Introduction
Every trader eventually asks the same question: why did the price move?
A currency pair spikes 200 pips in three minutes. Bitcoin drops 15% overnight. The euro rallies despite weak economic data. The dollar falls when employment numbers beat expectations. At first, markets seem chaotic — random noise with no discernible logic.
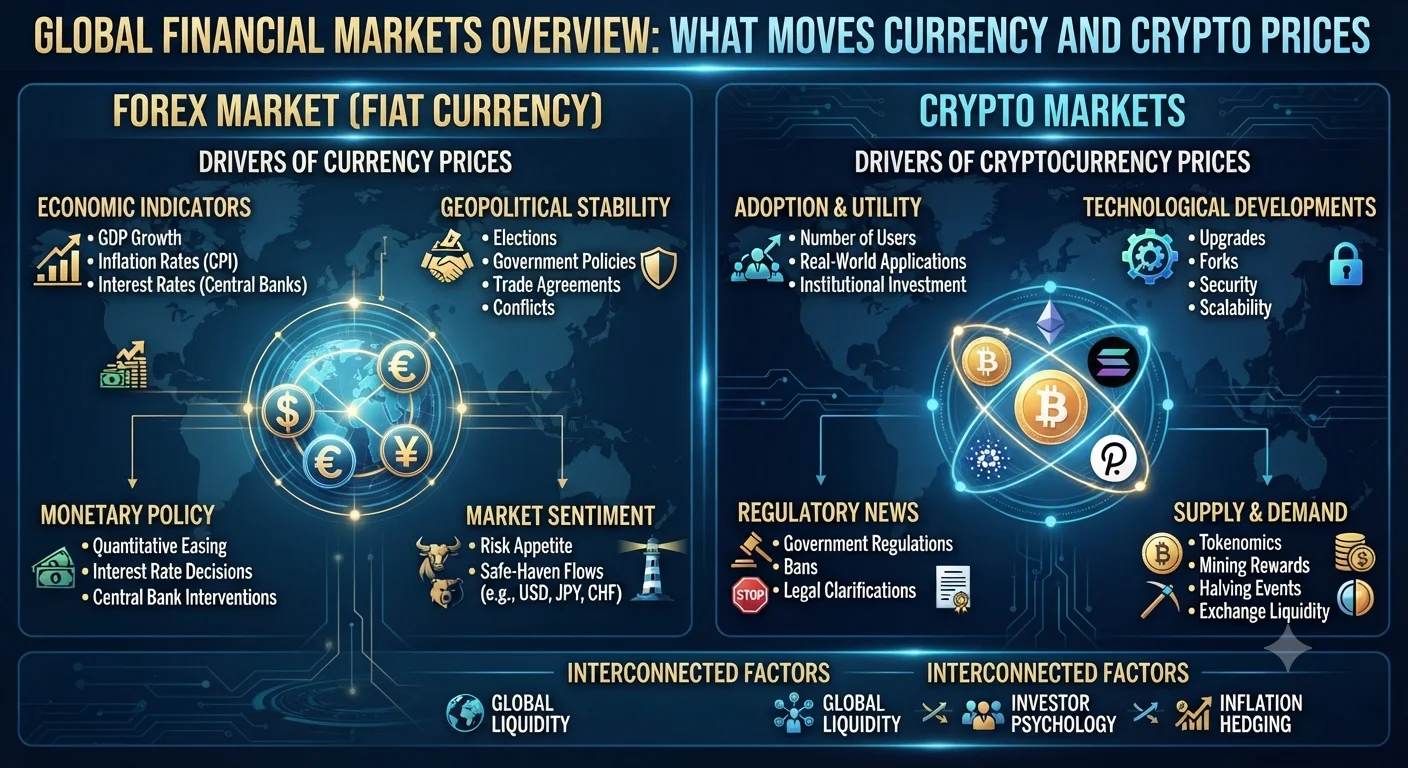
They are not random. Every significant price move has a cause — usually rooted in one of a handful of fundamental forces that professional traders and institutional investors monitor constantly. Understanding these forces does not guarantee profitable trading, but it is the essential foundation for making sense of the markets you are operating in.
This guide breaks down the key drivers of forex and crypto prices — from central bank policy to geopolitical risk to Bitcoin-specific supply mechanics — so that you can begin to see the logic beneath the movement.
Macroeconomic Factors That Drive Currency Prices
- Introduction
- Macroeconomic Factors That Drive Currency Prices
- The Key Macroeconomic Variables
- How Interest Rate Decisions Affect Forex
- Inflation Data and Currency Strength
- Geopolitical Events and Market Volatility
- Crypto-Specific Price Drivers
- Bitcoin Supply Mechanics
- The Bitcoin Halving
- Institutional Demand and ETF Flows
- Risk-On vs Risk-Off Sentiment
- On-Chain Metrics
- Risk-On vs Risk-Off: A Framework for Reading Markets
- Conclusion
Currencies are, at the most fundamental level, a reflection of confidence in a country's economy. When an economy is strong, growing, and politically stable, its currency tends to strengthen. When it is weak, contracting, or uncertain, its currency tends to weaken.
But markets are forward-looking. Prices do not reflect current reality — they reflect the expected future reality. This is why a currency can fall even when economic data looks good, if the data fell short of what the market had already priced in. The concept of expectations vs reality is central to understanding why prices move the way they do.
The Key Macroeconomic Variables
Gross Domestic Product (GDP) measures the total economic output of a country. Strong GDP growth signals a healthy economy and typically supports a stronger currency. Weak or contracting GDP tends to weaken a currency, particularly if it forces central banks to cut interest rates.
Inflation is the rate at which prices in an economy are rising. Moderate inflation (around 2%) is healthy and expected. High inflation erodes purchasing power and forces central banks to raise interest rates. This relationship — inflation leading to rate hikes, which affect currencies — is one of the most important chains of causation in forex trading.
Employment data provides insight into economic health. High employment suggests a growing economy with consumer spending power. The United States Non-Farm Payrolls (NFP) report, released on the first Friday of every month, is arguably the single most market-moving scheduled data release in all of forex.
Trade balance measures the difference between a country's exports and imports. A country that exports more than it imports (trade surplus) sees demand for its currency from foreign buyers. A country with a trade deficit sees its currency potentially weakened as it must buy foreign currency to pay for imports.
Government debt levels matter over long time horizons. Countries with unsustainably high debt-to-GDP ratios risk currency depreciation, particularly if bond markets lose confidence in their ability to service that debt.
How Interest Rate Decisions Affect Forex
Interest rates are the most powerful single driver of currency values in the short to medium term. When a central bank raises its benchmark interest rate, it becomes more attractive for global capital to hold assets denominated in that currency — because the returns are higher. This increased demand for the currency pushes its value up.
Conversely, when rates are cut, returns on that currency's assets decline, capital may flow elsewhere, and the currency tends to weaken.
The key concept here is interest rate differentials — the difference between two countries' rates, not the absolute level of either. If the US Federal Reserve has rates at 5% and the European Central Bank is at 3%, the interest rate differential favors the dollar. This is one reason the US dollar strengthened significantly throughout 2022 and 2023 as the Fed raised rates aggressively.
Traders watch central bank decisions obsessively not just for the decision itself, but for the forward guidance — the language central bankers use to signal future policy direction. A decision to hold rates steady accompanied by language suggesting future hikes can be just as bullish for a currency as an actual rate hike.
Key central banks and their currencies:
| Central Bank | Country/Region | Currency |
|---|---|---|
| Federal Reserve (Fed) | United States | USD |
| European Central Bank (ECB) | Eurozone | EUR |
| Bank of England (BoE) | United Kingdom | GBP |
| Bank of Japan (BoJ) | Japan | JPY |
| Reserve Bank of Australia (RBA) | Australia | AUD |
| Swiss National Bank (SNB) | Switzerland | CHF |
Inflation Data and Currency Strength
The relationship between inflation and currency value is nuanced and often misunderstood.
High inflation is generally negative for a currency in the long run — it erodes the real value of money. However, in the short term, high inflation prints can actually strengthen a currency if markets believe the central bank will respond with rate hikes.
This is why Consumer Price Index (CPI) releases — the primary measure of inflation in most developed economies — cause significant market volatility. Traders are not just reacting to the inflation number itself; they are updating their expectations about what the central bank will do in response.
The chain of causation:
- Inflation rises above target
- Central bank signals potential rate hike
- Traders buy the currency in anticipation of higher yields
- Currency strengthens
The reverse:
- Inflation falls below target
- Central bank signals potential rate cut
- Traders sell the currency
- Currency weakens
Understanding this chain allows traders to anticipate market reactions to data releases rather than simply react after the fact.
Geopolitical Events and Market Volatility
Markets do not exist in a vacuum. Wars, elections, trade disputes, sanctions, and political crises all move prices — often suddenly and without warning.
Safe haven flows are one of the most consistent geopolitical patterns in forex. When global uncertainty spikes — a war breaks out, a major bank fails, a pandemic begins — investors rush toward assets they perceive as safe. In forex, the traditional safe havens are the US dollar (USD), the Swiss franc (CHF), and the Japanese yen (JPY). Gold (XAU) is the classic safe haven commodity.
Recommended Articles
 MARKET NEWS
 MARKET NEWS
When you see USD, CHF, or JPY strengthening while global stock markets are falling, safe haven flows are almost certainly the explanation.
Elections create uncertainty, and markets dislike uncertainty. Countries with upcoming elections — particularly those with closely contested outcomes or candidates with radically different economic policies — often see their currencies become more volatile in the lead-up to the vote.
Trade disputes and tariffs directly affect currency values because they alter trade balances and supply chain economics. The US-China trade war from 2018 to 2020 caused significant volatility in the Chinese yuan, the Australian dollar (highly exposed to Chinese demand), and commodity currencies broadly.
Sanctions can have dramatic currency effects. The Russian ruble collapsed approximately 40% against the dollar within days of Russia's invasion of Ukraine in February 2022, before staged intervention by the Russian central bank stabilized it.
Crypto-Specific Price Drivers
Cryptocurrency markets share some drivers with traditional markets but have important unique factors that traders must understand.
Bitcoin Supply Mechanics
Unlike fiat currencies, which central banks can create in unlimited quantities, Bitcoin has a mathematically fixed maximum supply of 21 million coins. Approximately 19.7 million have already been mined as of 2025. The remaining supply enters circulation through mining, at a rate that halves approximately every four years.
This programmatic scarcity is fundamental to Bitcoin's value proposition as digital gold. As demand grows but supply growth slows (and eventually stops), basic supply and demand economics suggest upward price pressure — all else equal.
The Bitcoin Halving
The halving event, which reduces block rewards by 50%, has historically preceded significant bull markets — though the relationship is not guaranteed and past performance does not predict future results. The April 2024 halving reduced the daily issuance of new Bitcoin from approximately 900 BTC per day to 450 BTC per day. This supply shock, meeting consistent or growing institutional demand, creates conditions that many analysts view as structurally bullish.
Institutional Demand and ETF Flows
Since the approval of spot Bitcoin ETFs in the United States in January 2024, institutional capital has entered the Bitcoin market through a regulated, familiar vehicle. Daily ETF inflows and outflows from major providers like BlackRock's IBIT and Fidelity's FBTC have become closely watched indicators. Large inflow days tend to be associated with price strength; large outflow days with weakness.
Risk-On vs Risk-Off Sentiment
Crypto, particularly Bitcoin, has shown a moderate correlation with risk assets — particularly the NASDAQ technology index. During periods of broad market risk aversion (risk-off), Bitcoin often sells off alongside equities. During risk-on periods, it tends to rally. This correlation is not constant and has weakened at certain periods, but it is a useful framework.
When the Federal Reserve signals rate cuts — reducing the opportunity cost of holding non-yielding assets like Bitcoin — crypto markets tend to react positively. This is why FOMC meetings (Federal Open Market Committee) increasingly affect crypto prices alongside traditional markets.
On-Chain Metrics
Unlike forex, crypto markets have a unique data source: the blockchain itself. On-chain metrics provide real-time insight into market behaviour:
Exchange inflows/outflows: When large amounts of Bitcoin move onto exchanges, it may signal selling pressure (holders preparing to sell). When Bitcoin moves off exchanges into cold wallets, it suggests long-term accumulation — a bullish signal.
Hash rate: Rising Bitcoin hash rate reflects miner confidence in the network's future. Sustained high hash rate suggests miners are investing in infrastructure and not selling aggressively to cover costs.
Stablecoin supply ratio: The ratio of stablecoin supply to Bitcoin market cap. A high ratio suggests large amounts of capital sitting ready to deploy into crypto — a potential buying pressure signal.
Risk-On vs Risk-Off: A Framework for Reading Markets
Professional traders use the "risk-on / risk-off" framework constantly. Understanding it helps you interpret why seemingly unrelated assets move together.
Risk-on environment: Global sentiment is optimistic. Investors are willing to take on risk for higher returns. They buy equities, emerging market currencies, commodity currencies (AUD, CAD, NZD), and crypto. They sell safe havens like USD, JPY, and CHF.
Risk-off environment: Fear or uncertainty dominates. Investors sell risky assets and pile into safe havens. USD, JPY, CHF, and gold strengthen. Equities, crypto, and higher-risk currencies fall.
Triggers for risk-off include: geopolitical escalation, unexpected financial institution failures, global recession fears, major pandemic events, or unexpected central bank policy shifts.
Learning to read whether the current environment is risk-on or risk-off — through equity market performance, VIX (volatility index) levels, and currency flows — gives traders a macro context that dramatically improves their ability to understand individual price moves.
Conclusion
Markets move for reasons. Those reasons are usually rooted in economic data, central bank policy, geopolitical events, supply and demand mechanics, and the ever-shifting balance between risk appetite and fear.
No one can predict markets with certainty — if they could, the market would immediately price that prediction in and the edge would disappear. But understanding the fundamental forces that drive prices transforms market-watching from chaos into something much more structured and learnable.
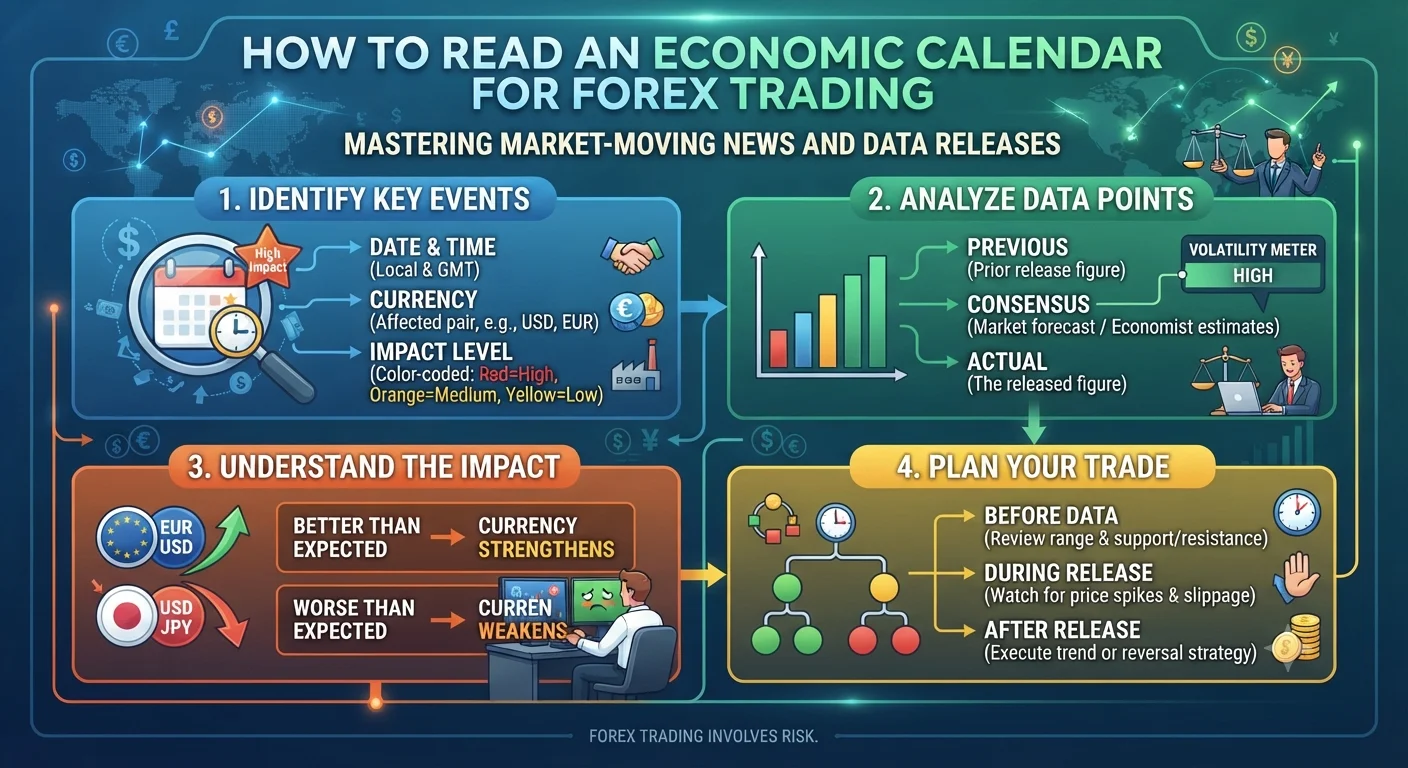
The next step in developing this understanding is learning how to read an economic calendar — so you know in advance which data releases and events have the potential to move the markets you trade.
Disclaimer: This article is for educational and informational purposes only. It does not constitute financial or investment advice. Trading forex and cryptocurrency involves significant risk. Always conduct your own research and consider seeking professional financial advice before making investment decisions.