Introduction
Before placing a single intelligent trade in the forex market you need to understand what you are looking at on your screen. Charts are the language of trading. Every professional trader reads them. Every strategy is built on them. At the heart of nearly every chart you will ever see are candlesticks.
Candlestick charting originated in 18th century Japan where rice traders used it to track price movements in commodity markets. Over three centuries later the same visual system is used on every trading platform on earth to represent price behaviour across every financial market.
This guide teaches you to read forex charts from the very beginning. You will learn what a candlestick is made of how to identify the most important patterns and how to connect what you see on a chart to actual trading decisions.
What is a Candlestick Chart?
- Introduction
- What is a Candlestick Chart?
- The Anatomy of a Candlestick
- Top 10 Candlestick Patterns Every Trader Should Know
- 1. Doji
- 2. Hammer
- 3. Shooting Star
- 4. Bullish Engulfing
- 5. Bearish Engulfing
- 6. Morning Star
- 7. Evening Star
- 8. Three White Soldiers
- 9. Three Black Crows
- 10. Spinning Top
- How to Use Patterns With Volume
- Support and Resistance as Context for Patterns
- Timeframe Selection and Pattern Significance
- Common Mistakes When Reading Charts
- Conclusion
A candlestick chart is a type of financial chart that displays price information over a chosen time period. Each individual candlestick represents one complete time period. That period could be one minute one hour one day or one week depending on the timeframe selected on your platform.
Candlestick charts show four pieces of information for each period. These four data points are known as OHLC data.
Open is the price at which the period began trading.
High is the highest price reached during the period.
Low is the lowest price reached during the period.
Close is the price at which the period ended.
This combination of four data points within a single visual element makes candlestick charts far more informative than simple line charts which only show the closing price. In forex trading the relationship between these four points tells you a great deal about who controlled price during that period and what momentum looked like at the close.
The Anatomy of a Candlestick
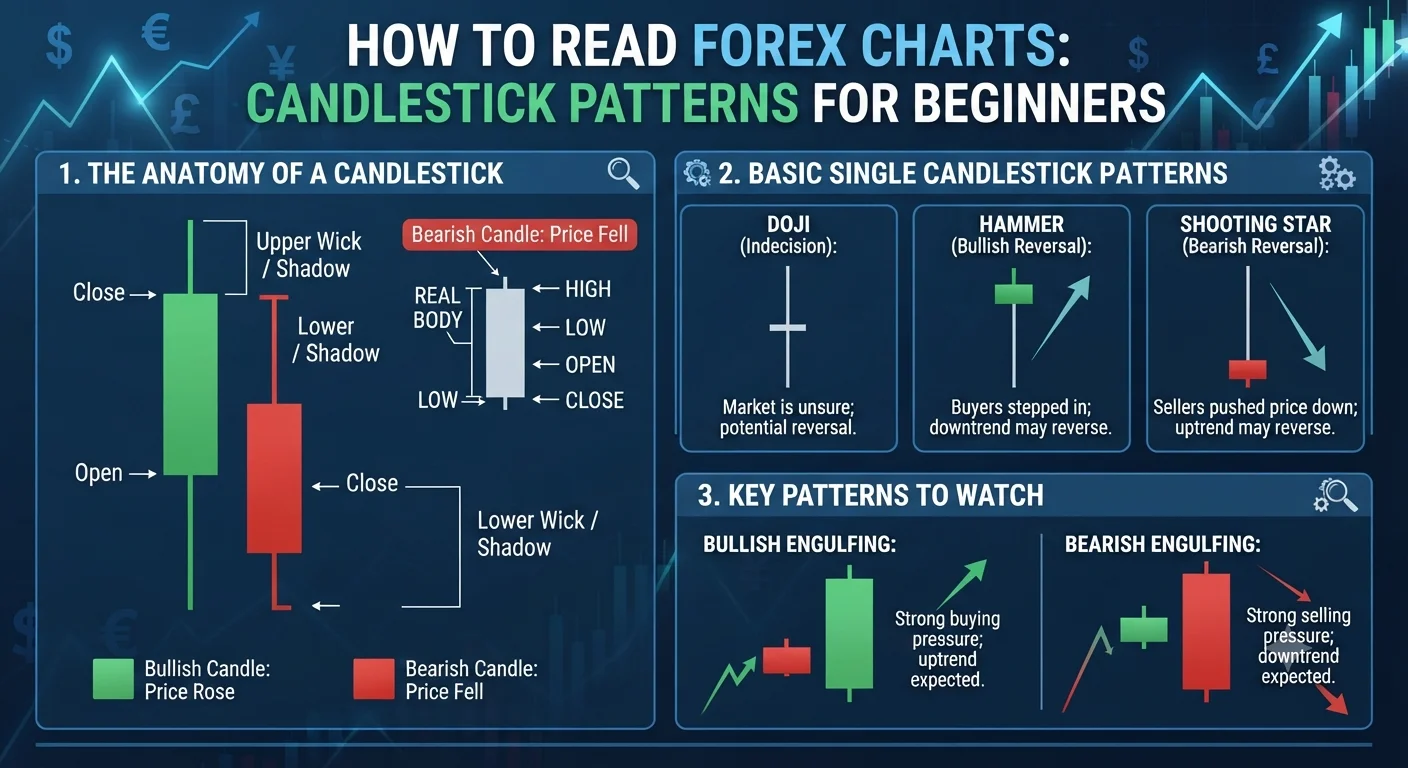
Every candlestick has two parts: the body and the wicks.
The body is the thick rectangular section of the candlestick. It represents the range between the opening price and the closing price. If the close is higher than the open the body is coloured green indicating bullish price action. If the close is lower than the open the body is coloured red indicating bearish price action.
The wicks are the thin lines extending above and below the body. The upper wick shows the distance between the top of the body and the highest price reached during the period. The lower wick shows the distance between the bottom of the body and the lowest price reached. Wicks are also called shadows or tails.
A large body indicates strong directional momentum. A small body indicates indecision where buyers and sellers were closely matched. Long wicks show that price tested certain levels but was rejected strongly suggesting those levels carry meaning for market participants.
Reading these visual cues quickly becomes natural with consistent daily practice on a demo account.
Top 10 Candlestick Patterns Every Trader Should Know
Candlestick patterns form when one or more candles create a recognisable shape that historically precedes a particular type of price behaviour. No pattern guarantees a specific outcome. Every pattern is a probabilistic signal that becomes more meaningful when viewed in context.
Context means where on the chart the pattern appears what the broader trend direction is and whether volume confirms the signal.
1. Doji
A doji forms when the opening and closing prices are virtually equal resulting in a very small body. The candle looks like a cross or plus sign. A doji signals indecision. Neither buyers nor sellers won the period decisively. In the context of a strong trend a doji can signal that momentum is fading and a reversal may be approaching.
2. Hammer
A hammer is a bullish reversal pattern that appears after a downtrend. It has a small body near the top of the candle and a long lower wick at least twice the length of the body. The long lower wick shows that sellers pushed price sharply lower during the period but buyers stepped in strongly and pushed it back up before the close. This rejection of lower prices is a bullish signal.
3. Shooting Star
The shooting star is the bearish mirror image of the hammer. It appears after an uptrend and has a small body near the bottom of the candle with a long upper wick. It shows that buyers pushed price significantly higher during the period but sellers took control and drove it back down before the close. This rejection of higher prices is a bearish signal.
4. Bullish Engulfing
A bullish engulfing pattern consists of two candles. The first is a bearish red candle. The second is a bullish green candle whose body completely engulfs the first candle's body. It opens lower and closes higher than the previous candle. This pattern suggests that bullish momentum has overwhelmed the previous bearish pressure and signals a potential reversal to the upside.
5. Bearish Engulfing
The bearish engulfing is the opposite. A bullish green candle is followed by a larger bearish red candle that completely engulfs it. This signals that bearish momentum has taken control and a downward move may follow.
6. Morning Star
A morning star is a three candle bullish reversal pattern. The first candle is a large bearish red candle continuing the downtrend. The second is a small candle showing continued selling but with diminishing momentum. The third is a large bullish green candle that closes well into the first candle's body. Together these three candles tell the story of bears losing control and bulls taking over.
7. Evening Star
The evening star is the bearish counterpart to the morning star. It consists of a large bullish candle followed by a small indecisive candle then a large bearish candle that closes well into the first candle's body. It signals a potential top and reversal to the downside.
8. Three White Soldiers
Three white soldiers is a bullish continuation pattern made up of three consecutive large bullish green candles. Each candle opens within the previous candle's body and closes near its high. This pattern shows sustained buying pressure and strong bullish momentum.
Recommended Articles
 FOREX TRADING
 FOREX TRADING
 FOREX TRADING
 FOREX TRADING
9. Three Black Crows
Three black crows is the bearish equivalent. Three consecutive large bearish red candles each opening within the previous candle's body and closing near its low. This demonstrates consistent and powerful selling pressure.
10. Spinning Top
A spinning top has a small body with upper and lower wicks of roughly equal length. Like a doji it signals indecision but with slightly more price movement during the period. In a strong trend a spinning top suggests that prevailing momentum is beginning to weaken.
How to Use Patterns With Volume
Volume is the number of trades executed during a given time period. In forex the overall market has no centralised volume data because trades occur across decentralised networks. Most platforms provide a tick volume indicator which counts the number of price changes per period. This serves as a reasonable proxy for actual traded volume.
Volume adds meaningful context to candlestick patterns. A bullish engulfing pattern accompanied by high volume is far more significant than the same pattern on very low volume. High volume confirms that a large number of participants were involved in the move which gives the signal greater weight.
A pattern that forms on abnormally low volume should be treated with caution. It may indicate a temporary and shallow move rather than a genuine shift in market direction.
When using any of the patterns in this guide look at volume alongside the pattern. If volume expands as a reversal pattern forms the case for the signal strengthens. If volume is thin the pattern is weaker and further confirmation should be waited for before acting.
Support and Resistance as Context for Patterns
The location of a pattern on a chart matters just as much as the pattern itself. A hammer that forms at a major support level carries far more weight than a hammer that forms in the middle of open price space with no nearby reference points.
Support is a price level where buying interest has historically been strong enough to stop or reverse a decline. Resistance is a price level where selling interest has historically been strong enough to stop or reverse a rally. These levels form because market participants remember where price turned before and adjust their behaviour accordingly.
When a candlestick reversal pattern forms at a strong support or resistance level the combination of pattern plus location creates a high probability setup. The pattern shows what is happening in the immediate price action. The level shows why that location matters to the market.
Learning to read candlestick patterns and support or resistance levels together is one of the most foundational skills in forex technical analysis.
Timeframe Selection and Pattern Significance
The timeframe you trade on determines which candlesticks you see and how significant the patterns are. A doji on a one minute chart carries much less weight than a doji on a daily chart. Higher timeframe candles represent more trading activity more participants and therefore more meaningful price behaviour.
Common timeframes and their primary uses:
One minute and five minute charts are used by scalpers who open and close trades within minutes.
Fifteen minute and thirty minute charts are popular with short term day traders.
One hour and four hour charts are used by swing traders who hold positions for hours to days.
The daily chart is used for position trading and for identifying the major trend direction.
The weekly chart provides the highest level view of price structure and is used for identifying major support and resistance zones.
A practical approach for beginners is to identify trend direction on the daily chart and then look for entry signals on the one hour or four hour chart. This approach is called multiple timeframe analysis and it prevents you from trading against the dominant trend.
Common Mistakes When Reading Charts
Trading patterns in isolation without trend context is the most damaging mistake. A hammer at the bottom of a downtrend is a meaningful signal. The same candle shape appearing in the middle of an uptrend means very little. Context determines meaning.
Ignoring the surrounding price structure is another common error. Where a pattern appears on the chart matters enormously. A bullish engulfing at a major support level is far more powerful than the same pattern in empty price space.
Acting on every pattern regardless of quality leads to overtrading. Patterns should be filtered. Look for the ones that occur at meaningful price levels with volume confirmation and clear trend context. Most patterns observed will not meet all three criteria and should be passed over.
Expecting patterns to always work creates unrealistic expectations. No pattern in forex has a 100% success rate. Professional traders do not look for certainty. They look for high probability setups where the potential reward justifies the risk even knowing that some trades will be losers.
Conclusion
Reading candlestick charts is a foundational skill that every forex trader must develop. The patterns in this guide represent centuries of accumulated market observation about the relationship between buying pressure and selling pressure. They are not magic signals but they are meaningful tools when read in context.
Start by focusing on the basic anatomy of a candlestick until you can immediately identify the open close high and low at a glance. Then practise recognising the major reversal and continuation patterns on a demo account before trusting them with real capital.
As your chart reading ability improves you will begin to see price behaviour as a story rather than a series of random movements. That shift in perception is what separates traders who understand markets from those who merely guess at them.
Disclaimer: This article is for educational and informational purposes only. It does not constitute financial or investment advice. Forex trading involves significant risk of loss. Always conduct your own research before trading.
Related Articles: What is Forex Trading? A Beginner's Complete Guide for 2026 Best Forex Indicators for Beginners in 2026 Technical Analysis for Forex: Moving Averages RSI and MACD